


-
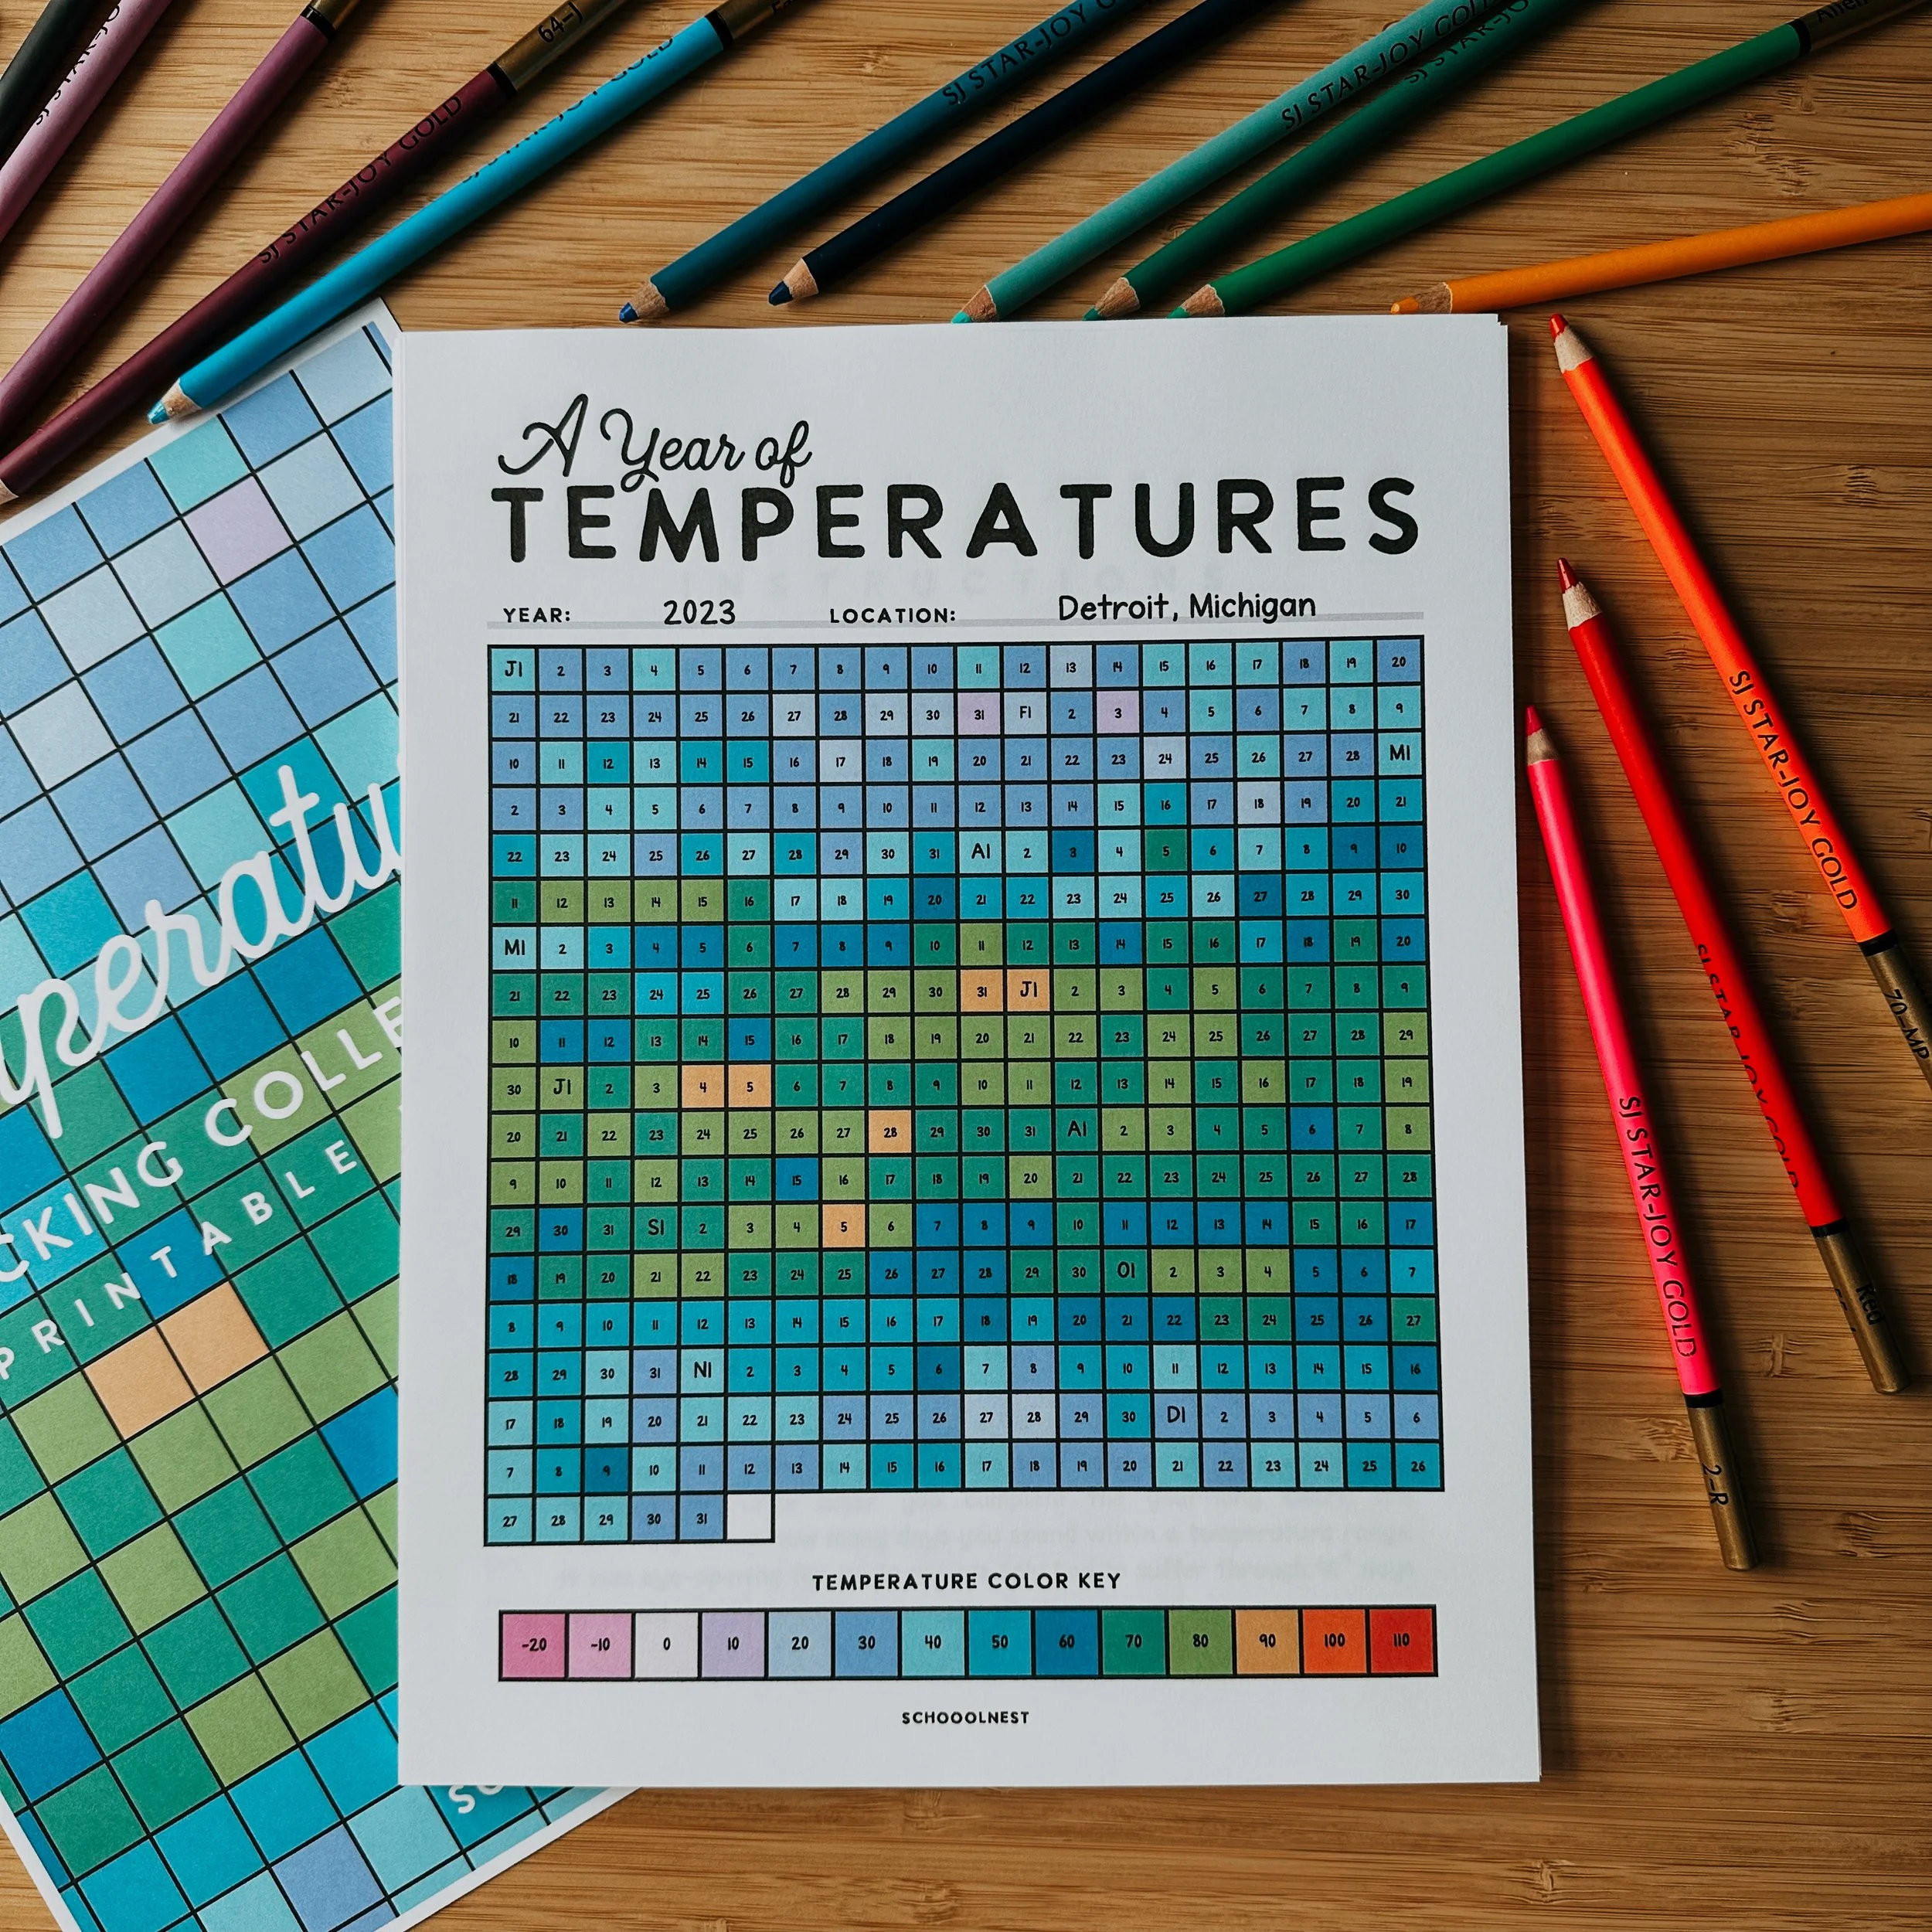
The Temperature Tracking Printable Collection is designed to help you and your students explore weather patterns over time—whether you're curious about temperatures, rainfall, or wind. These printable charts turn data into a colorful visual story, perfect for weather studies, nature journaling, or just for fun.
This digital collection includes multiple layouts so you can choose the best fit for your learning goals:
A Year of Temperatures – Track a full year of daily temperatures through color.
A Year of Weather Data – Adapt the chart to track precipitation, wind speed, or other weather details.
Two Years of Temperatures – Compare two years side by side in a vertical layout.
Temperature Range Graphs – Log daily highs and lows each month to see patterns across the year.
On This Day Temperature Range Graph – Record the high and low temperatures on one specific day across a decade.
A Decade of Temperatures – Visualize long-term weather trends by comparing monthly temperatures over ten years.
Important Note on Digital Delivery & Storage:
Upon purchase, you will receive an automated link to download your files. To ensure you have permanent access to your purchase, please save the files to your personal device or cloud storage immediately.
As a small business, we are unable to provide ongoing file hosting or "re-send" services for past purchases. It is the customer’s responsibility to back up and store their digital files. We recommend saving a copy to a secondary location (like Google Drive or Dropbox) to ensure you have it for years to come!
Details
Pages: 54
Size: 8.5 x 11 inches
Printable PDF Product - delivered digitally
Original design by schoolnest